The new Core Web Vitals update was finally released! Earlier this year, Google released a product review update that targets only (you guessed it) product review pages, but Core Web Vitals are going to affect every website. This new update is much wider in scope, and no website will be left untouched. So you’d best be ready.
You’ve most likely already heard about Core Web Vitals over the past few months – indeed, they have been a major topic since the last year. If you have already prepared your site for it, great work! If you haven’t, or if you are worried you might still be missing something, then you have come to the right place. Let’s look into what exactly Core Web Vitals are, what makes them so global and how to optimize your website for this new Google update.
What are the Core Web Vitals?
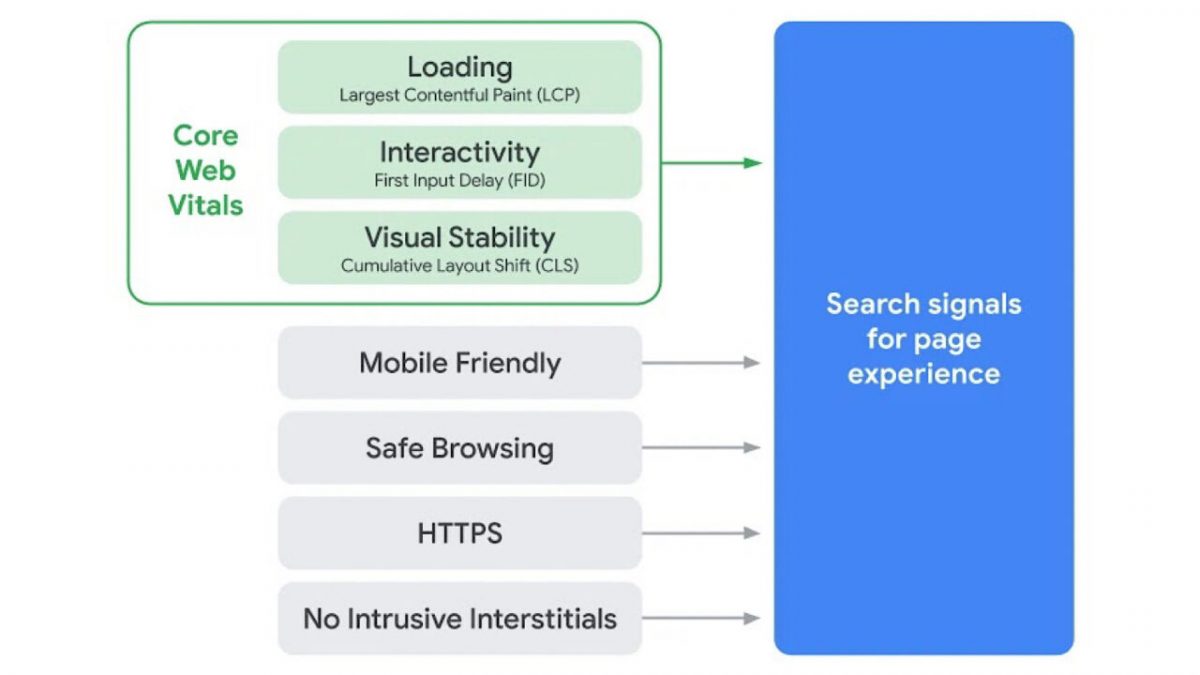
It’s simple: Core Web Vitals are signals which measure the quality of the user experience on a page. There are three of them:
- Cumulative Layout Shift. It’s responsible for a page’s visual stability.
- Largest Contentful Paint. It’s tied to a page’s loading speed.
- First Input Delay. It shows the quality of your pages’ interactivity, how responsive they are.
Let’s explore each of the three.
1. Cumulative Layout Shift (CLS)
First, let’s define CLS: it’s the sum of all layout shifts that occur while a web page is opened in your browser. And what is a layout shift? It means that a visible element changes its position on a page from one rendered frame to the next.
The browser calculates CLS by looking at the viewport size and the movement of unstable elements in the viewport between two rendered frames. The layout shift score is a product of two measures of that movement: the impact fraction and the distance fraction.
So, Layout shift score = impact fraction * distance fraction.
Ideally, CLS should be under 0.1. Of course, perfect readings on websites are hard to achieve, so you should still be fine in the orange zone, which is under 0.25. If your CLS is any higher than that number, it’s time to start worrying.
Simply put:
Your CLS < 0.1: perfect
0.1 < your CLS < 0.25: optimal, but could be improved
Your CLS > 0.25: needs fixing
There are a few ways to check your CLS and the other Core Web Vitals metrics. One is to open the developer’s tools in your browser. In Chrome, for example, you need to press F12 or Ctrl-Shift-I and open the Performance tab. Reload the page, and you will see something like this:
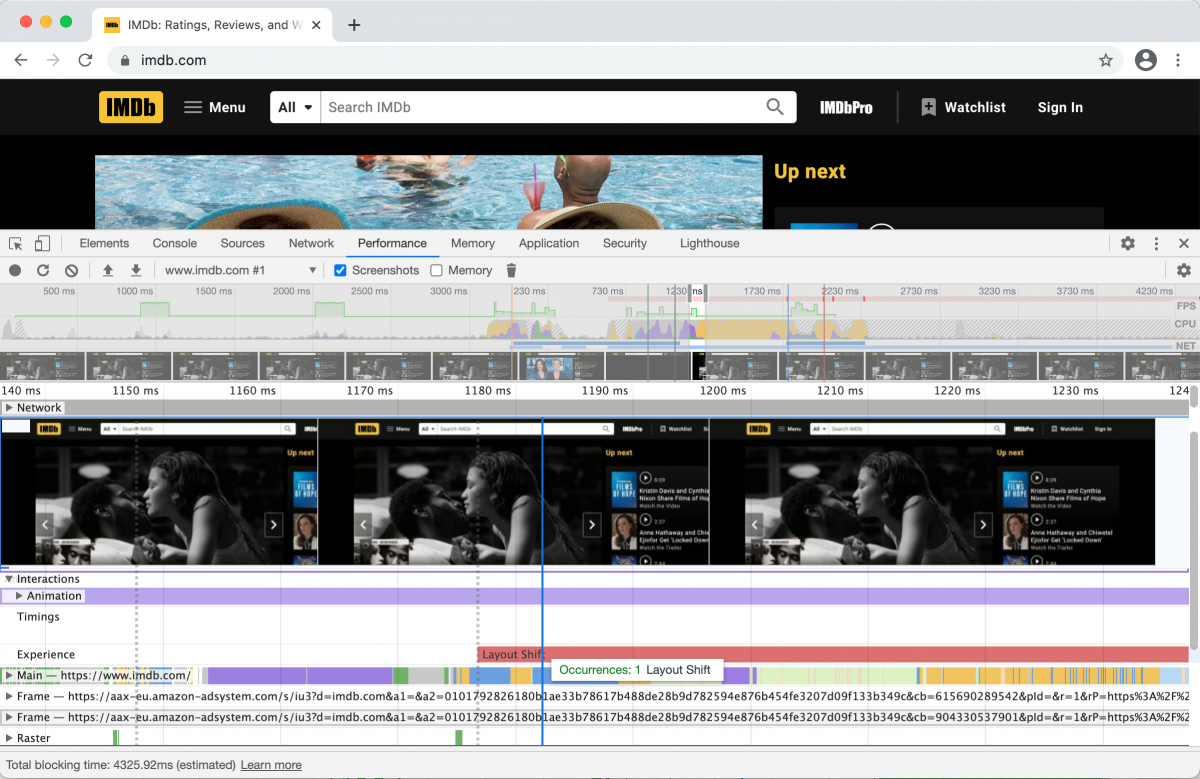
If it took you a while to find CLS there, you are not the only one. It doesn’t look any more appealing in other browsers either. There’s an easier way to find this information: with SEO tools.
Open the Desktop Speed report in WebCEO and you will see this:
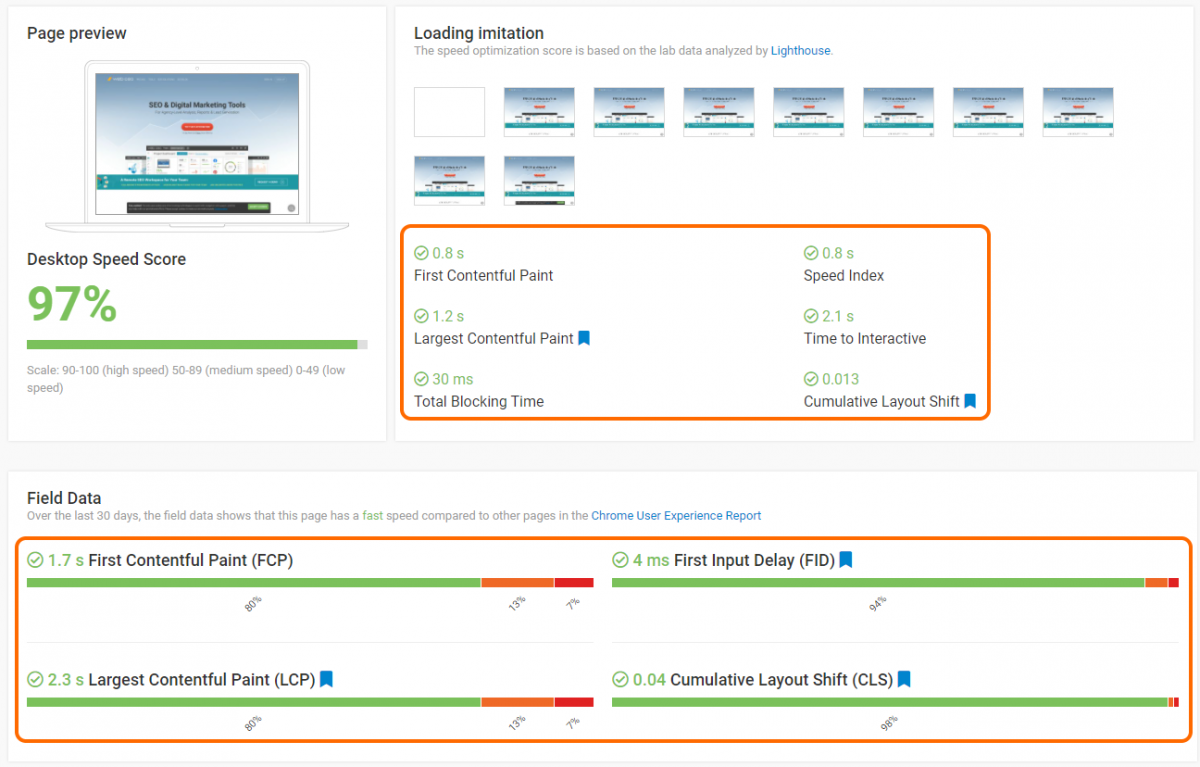
Much better and straight to the point.
If you check the list of found issues in the report, you may find the types of issues which lower the quality of your CLS:
- Large layout shifts;
- Render-blocking resources;
- Text hidden during web font load;
- Not preloaded key requests;
- Improperly sized images.
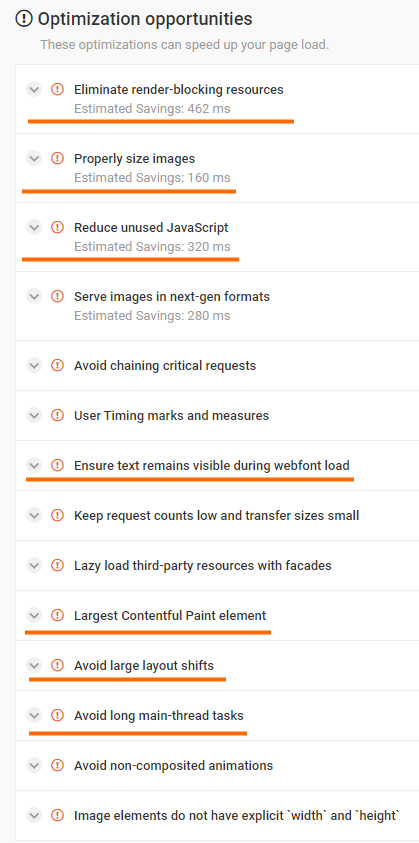
(Note: underlined issues in the picture above are related to all Core Web Vitals, not just CLS.)
Click on the issues to expand them and see the details, then fix them and rescan the page to see the improvements.
2. Largest Contentful Paint (LCP)
LCP measures the loading speed of your site’s content. Specifically, it isn’t all content, but only its largest part in the first scroll of a page. For example, if you have a large banner in the top of your page, that’s what LCP will choose for its judgement (unless you have something even bigger).
Here’s an example of what LCP looks like in action:
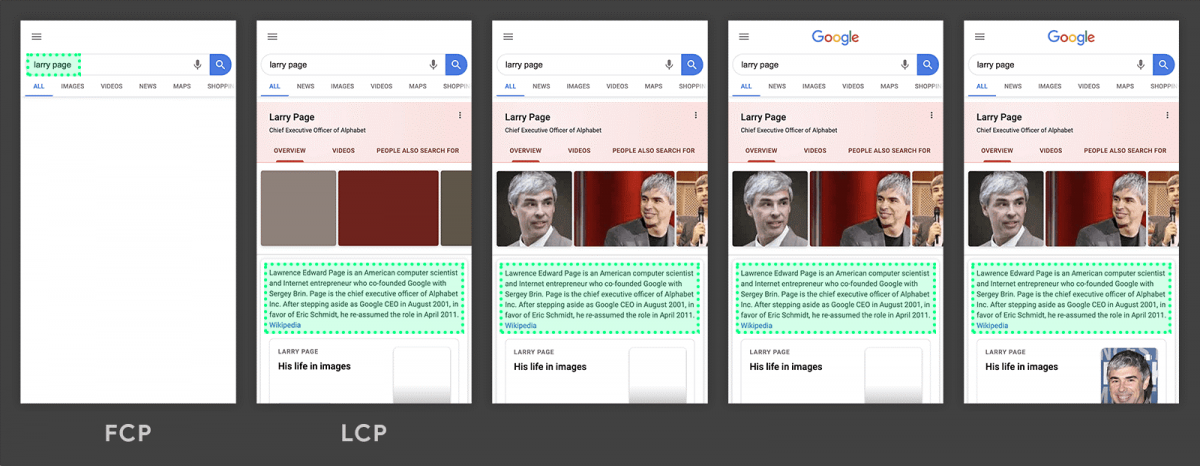
The largest element is a paragraph of text that is displayed before any of the images or logo finish loading. Since all the individual images are smaller than this paragraph, it remains the largest element throughout the load process.
An ideal LCP is under 2.5 seconds. It stops being comfortable at after 4 seconds, which is definitely a sign that something needs fixing.
Your LCP < 2.5s: perfect
2.5s < your LCP < 4s: optimal, but could be improved
Your LCP > 4s: needs fixing
Same as CLS, LCP can be checked in your browser’s developer’s tools (e.g. the Performance tab in Chrome). But we’ve already demonstrated a better option, haven’t we?
Open the Desktop Speed report in WebCEO again. If you don’t like what it shows for your LCP, scroll down to see what causes it to be so poor. Actually, a good practice is to check the list of found issues anyway, just in case.
Here are some of the most common issues affecting LCP that you may find in the report:
- High request counts and large transfer sizes;
- High network round-trip time;
- Critical request chains;
- High initial server response time;
- Images not served in next-gen format.
3. First Input Delay (FID)
FID measures the time between the users interacting with the page (e.g. by clicking on a button) and the browser starting to respond to the interaction. The shorter this time, the sooner the users get what they want, so you want FID to be low.
To be as specific as possible: FID is not the whole time between the input and the end result (like a form appearing on the screen). It ends when the browser begins to process the response.
An FID of 100 milliseconds and lower is perfect. Any higher than 300 ms puts you into the red zone.
Your FID < 100ms: perfect
100ms < your FID < 300ms: optimal, but could be improved
Your FID > 300ms: needs fixing
FID can be checked in the Main tab of Chrome’s DevTools or in the same Desktop Speed report we’ve been using so far.
Some of the most commonly occurring FID-related issues are:
- Inefficient cache policy;
- Long main-thread tasks;
- Unused JavaScript;
- Unused CSS;
- Excessive Document Object Model size.
Afterword
What do you think? Optimizing your website for Core Web Vitals is much easier than you imagined, isn’t it? All it takes is to keep an eye on specific kinds of site issues. You’ve already done it before, now you simply need to pay them a little more attention.
The new update is going to roll out soon, and the SEO world has been prepared for it for a long time now. You have both the information and the tools at your disposal. Check your website now and see what you can do!
